
Self-Service Data Analytics and Dashboards Built With AI
Ask business questions in plain language and turn governed enterprise data into interactive charts and dashboards — no coding or chart configuration required.
Business Questions Should Not Wait for a Dashboard Backlog
In most organisations a new question becomes a request. Someone specifies the metric, an analyst finds time in the queue, fields and chart types are configured by hand, and by the time the view is ready the decision has usually been taken with whatever number was available. Conventional data analysis tools were designed for the people who build reports, not the people who need them.
The workarounds are familiar. Figures get exported to spreadsheets and circulated by email. Two teams build the same measure differently and arrive at a meeting with conflicting totals. Dashboards that were accurate at launch quietly drift out of date because nobody owns the refresh. Hours that should go into interpreting information go into configuring charts instead.
Self service data analytics changes who can ask. When governed data is combined with natural-language interaction, an authorised business user can pose a question directly, see a chart, adjust it and move on — while the definitions, permissions and lineage stay under control. That is the difference between business analytics tools that serve a reporting team and tools that serve the business.
Describe the Analysis. Let AI Build the Dashboard.
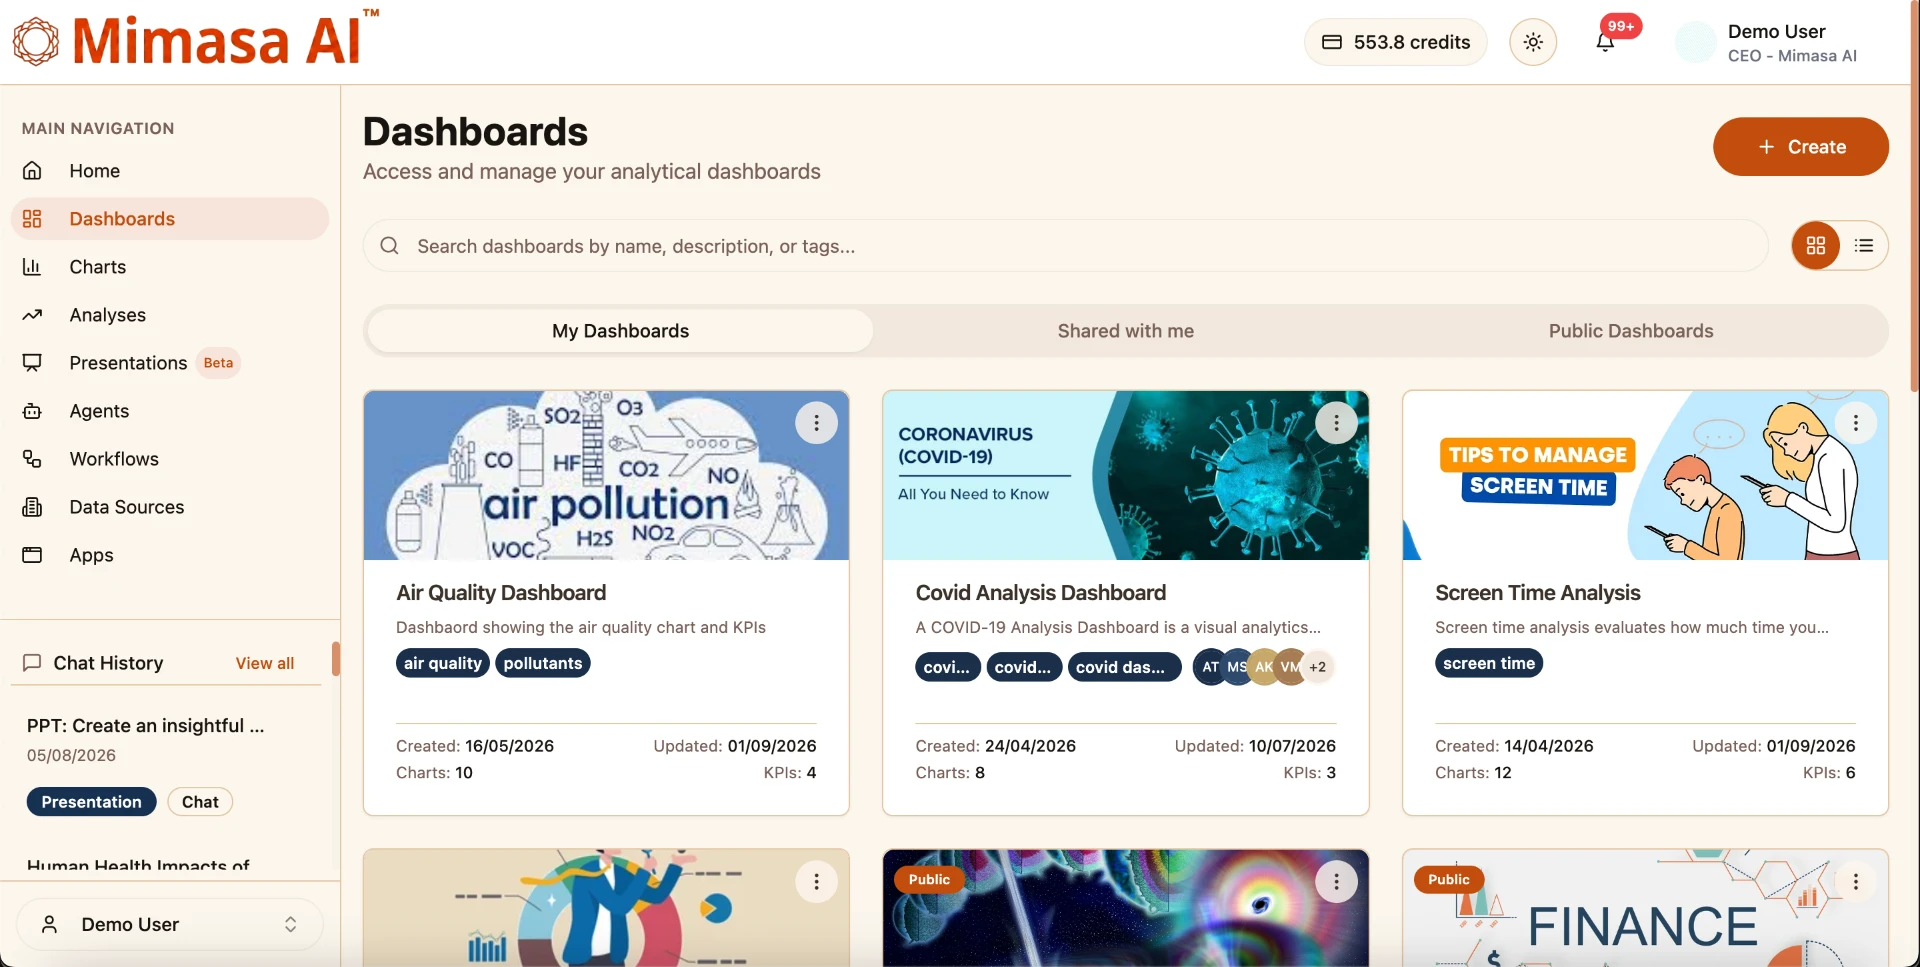
Mimasa AI works as a dashboard creator that starts from a sentence instead of a settings panel, turning a request into dashboard data visualization you can immediately explore.
How The Workflow Runs
- 1Select a governed dataset or intelligent data snapshot.
- 2Ask your business question in natural language.
- 3Mimasa AI interprets the measures, dimensions and comparison involved.
- 4An appropriate chart is generated for you to review.
- 5Combine several visualizations into one analytics dashboard.
- 6Refine layout, labels, colours or filters with further instructions.
- 7Save the dashboard and share it with the right people.
Because each step is conversational, data information analysis becomes iterative: you look at a result, ask the next question and keep narrowing until the picture is genuinely useful.
Prompts People Actually Use
These are the same requests normally sent to a reporting queue. With AI tools for data analysis built into the platform, they resolve in the flow of work.
Natural Language Queries
KPI Performance Tracking
See The AI Dashboard Creator In Action
Watch how a governed dataset becomes a chart, how charts become an analytics dashboard, and how a follow-up instruction reshapes the view without reopening a configuration panel.
The same experience covers filters, drill-downs and sharing, so what you see here is what an authorised business user works with day to day.
An AI Dashboard Creator for Everyday Business Analysis
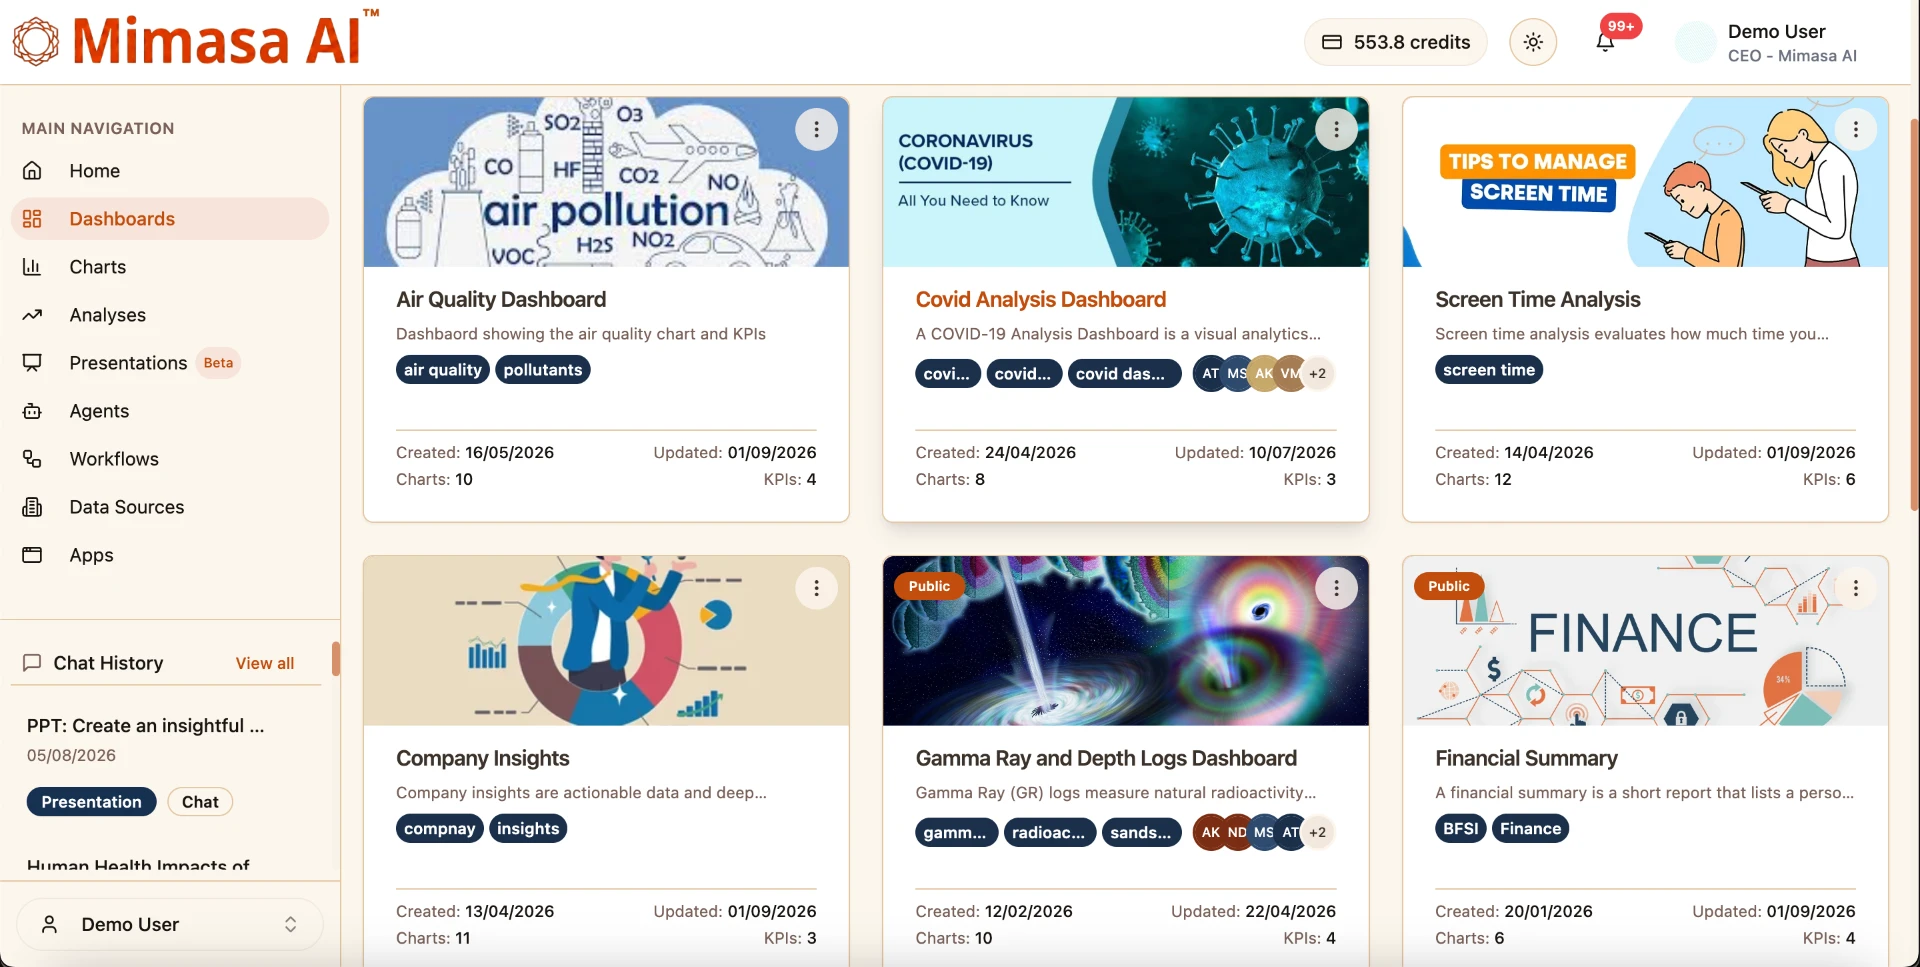
Six capabilities cover the full life of a dashboard: creating it, exploring it, keeping it current and sharing it responsibly.
Generate Charts From Natural Language
Describe a comparison, trend, distribution or relationship and Mimasa AI creates a suitable visualization from a governed dataset or intelligent data snapshot — no field pickers, no chart wizard.
Build Interactive Dashboards
Combine several charts into one analytics dashboard, arrange panels and resize components until the view matches how your team actually reads the business.
Explore With Filters And Drill-Downs
Viewers filter, hover for tooltips and drill into the detail behind a number, which turns dashboard data visualization into an exploration surface rather than a static image.
Keep Dashboards Connected To Data
Dashboards built on connected governed datasets reflect updates as that data refreshes, so the view a director opens on Monday is not last quarter's export.
Customize Through Natural Language
Change colours, labels, legends and layout by describing the change. Digital dashboard software should not require a settings tour before a chart is presentable.
Share Securely
Share dashboards with the stakeholders who need them while role-based access controls decide who can view, edit or reshare each one.
Choose the Right View for Every Business Question
Mimasa AI suggests a suitable visual format from your request and the data available, so the chart fits the question rather than the other way round.
Bar Charts
Compare values across categories, regions, products or teams.
Line Charts
Identify trends and movement over time at a glance.
Pie Charts
Show proportions and how a total splits across segments.
Area Charts
Follow cumulative patterns and how volume builds up.
Scatter Plots
Explore relationships and correlations between variables.
Data Tables
Inspect detailed records behind a summarised figure.
Build Dashboards on Governed Enterprise Data
Self-service does not mean uncontrolled access. Every dashboard in Mimasa AI is built on governed datasets and intelligent data snapshots, so teams work from consistent metrics, users see only the data they are authorised to access, and several dashboards can share one agreed definition instead of one spreadsheet each.
- Consistent metric definitions across teams
- Access rules travel with the data, not the dashboard
- One governed dataset can feed many dashboards
- Fewer disagreements caused by separate exports
- Ownership and lineage stay part of the workflow
- Dashboards sit on the wider Data Intelligence foundation
That governed layer is also what makes an AI data catalog useful rather than decorative: when data and analytics software understands what a field means and who may see it, natural-language questions can be answered safely.
Move From Static Reports to Connected, Real-Time Analytics
A chart pasted into a slide stops being data the moment it is copied. It carries no filters, no lineage and no way to check the number underneath, and it ages silently until someone notices the total no longer matches the system of record.
Mimasa AI keeps the connection intact. Dashboards read from governed datasets and reflect updates as that connected data refreshes, which is what modern real-time analytics platforms are really offering most of the time: current information rather than continuous streaming. Where a source supports frequent refreshes you effectively get realtime dashboards; where it does not, the dashboard follows the schedule that source allows, and the platform does not pretend otherwise.
Because Mimasa AI runs as cloud analytics software, that live business data reaches whoever is authorised to see it without another export, another copy or another version of the truth.
Go Beyond Charts With AI-Assisted Data Analysis
Artificial intelligence for data analytics is most useful in the gap between a question and a usable view. Mimasa AI helps identify the relevant fields, choose an appropriate chart type, summarise what a trend is doing, compare segments, explore anomalies, refine an existing visualization and take the next follow-up question — behaving like a data analysis agent alongside the person doing the thinking.
Natural-language analytics reduces configuration effort; it does not replace judgement. Data analytics and artificial intelligence work best when governed data supplies the facts and an experienced person decides what they mean.
One Analytics Platform for Multiple Business Teams
The same business data analytics solution serves finance, sales, marketing, operations, customer teams and public-sector analysts, each working within their own permissions.
Finance Analytics
- Revenue and cost trends
- Budget-versus-actual comparisons
- Working-capital monitoring
- Invoice-processing performance
- Management dashboards
Sales Analytics
- Pipeline movement
- Regional sales
- Product performance
- Conversion analysis
- Account-level trends
Marketing Analytics
- Campaign performance in a campaign analytics dashboard
- Channel comparisons across marketing dashboards
- Lead-generation trends
- Acquisition metrics in a marketing performance dashboard
Operations And Supply Chain
- Delivery performance
- Production trends
- Exceptions by plant
- Inventory movement
- Supplier performance
Customer Analytics
- Customer behaviour and segments
- Retention trends
- Service volumes
- Support performance
- An alternative to standalone customer analytics platforms
Government And Public Sector
- Programme monitoring
- Scheme performance
- Regional comparisons
- Operational reporting
- Public-service indicators
Analyst teams can go deeper with role-specific guidance on the Mimasa AI hub for analysts.
Mimasa AI vs Traditional Dashboard and BI Tools
Established business intelligence solutions are capable products. The difference here is the user experience and how far an insight travels afterwards.
| Capability | Traditional Dashboard Tools | Mimasa AI |
|---|---|---|
| Dashboard creation | Manual field and chart configuration | Natural-language dashboard creation |
| User requirements | Often requires BI expertise | Designed for business and analytical users |
| Chart customization | Manual settings | Natural-language instructions and controls |
| Data foundation | May depend on separate exports | Governed datasets and intelligent snapshots |
| Follow-up questions | New configuration may be required | Iterative natural-language refinement |
| Interactivity | Depends on manual setup | Filters, drill-downs and tooltips |
| Sharing | Platform-specific | Governed team sharing with role-based access |
| Automation | Often handled separately | Connected to Mimasa reports, agents and workflows |
Compared with conventional data visualization platforms and business intelligence reporting tools, the shift is from configuring software to describing an outcome — while the governed data foundation behind these business analytics tools stays intact.
Connect Dashboards With Data, Reports, Agents and Workflows
Visualization is not the end of the line. A chart can start a report, inform a decision or trigger an automated business action.
Data Extraction And Connectivity
Bring information in from databases, documents, spreadsheets, APIs and enterprise applications.
Explore data extraction and connectorsData Transformation
Clean, combine and prepare information before it reaches a chart.
See no-code data transformationIntelligent Data Snapshots
Create consistent, reusable views that several dashboards can share.
Build dashboards from intelligent data snapshotsInsights And Automated Reporting
Turn what a dashboard shows into scheduled or on-demand reports.
Explore AI insights and automated reportingData Presentation
Turn analysis and charts into presentations ready for a business audience.
See AI-powered data presentationAI Agents And Workflows
Let analytical findings trigger agents and operational workflows, not just another meeting.
Explore the AI agent builderFindings can also drive execution through agentic workflow automation, so a trend spotted on a dashboard turns into an action rather than a note.
Why Enterprises Choose Self-Service Data Analytics
AI Data Visualization and Dashboard FAQs
Common questions about self service data analytics, dashboard creation and governed data in Mimasa AI.