
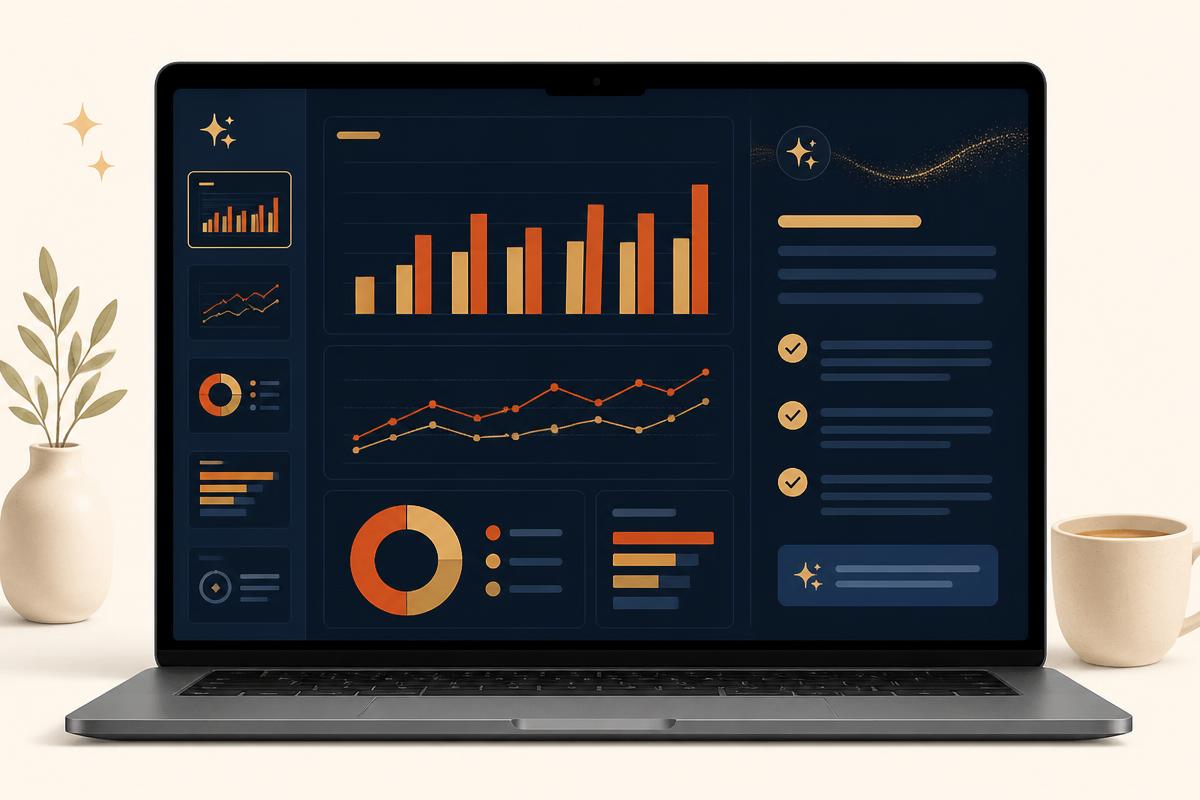
Most Of The Effort Happens After The Analysis Is Finished
Enterprises invest heavily in extraction, preparation, dashboards and reporting, and then spend hours converting the result into slides by hand. Data storytelling is where analysis either becomes a decision or quietly dies in a deck nobody finishes reading.
The Analysis Is Done, The Story Isn't
The numbers exist in dashboards and reports, but somebody still has to decide what matters, in what order, and what the audience should do about it.
Slides Age The Moment They Are Built
Figures pasted into a deck are frozen. By the review meeting the source has moved on, and the pack has to be rebuilt rather than refreshed.
Every Team Tells A Different Version
When decks are assembled from private exports, two departments arrive with different totals for the same month and the meeting becomes a reconciliation exercise.
Automated reporting solves part of this by producing the written analysis. Presentation closes the last gap: arranging that analysis for a specific audience, in a specific meeting, with a recommendation attached.
From Governed Data To A Finished Deck In Five Steps
The presentation is generated from the same governed data your dashboards and reports already use, so the deck and the dashboard never disagree.
Start From Governed Data
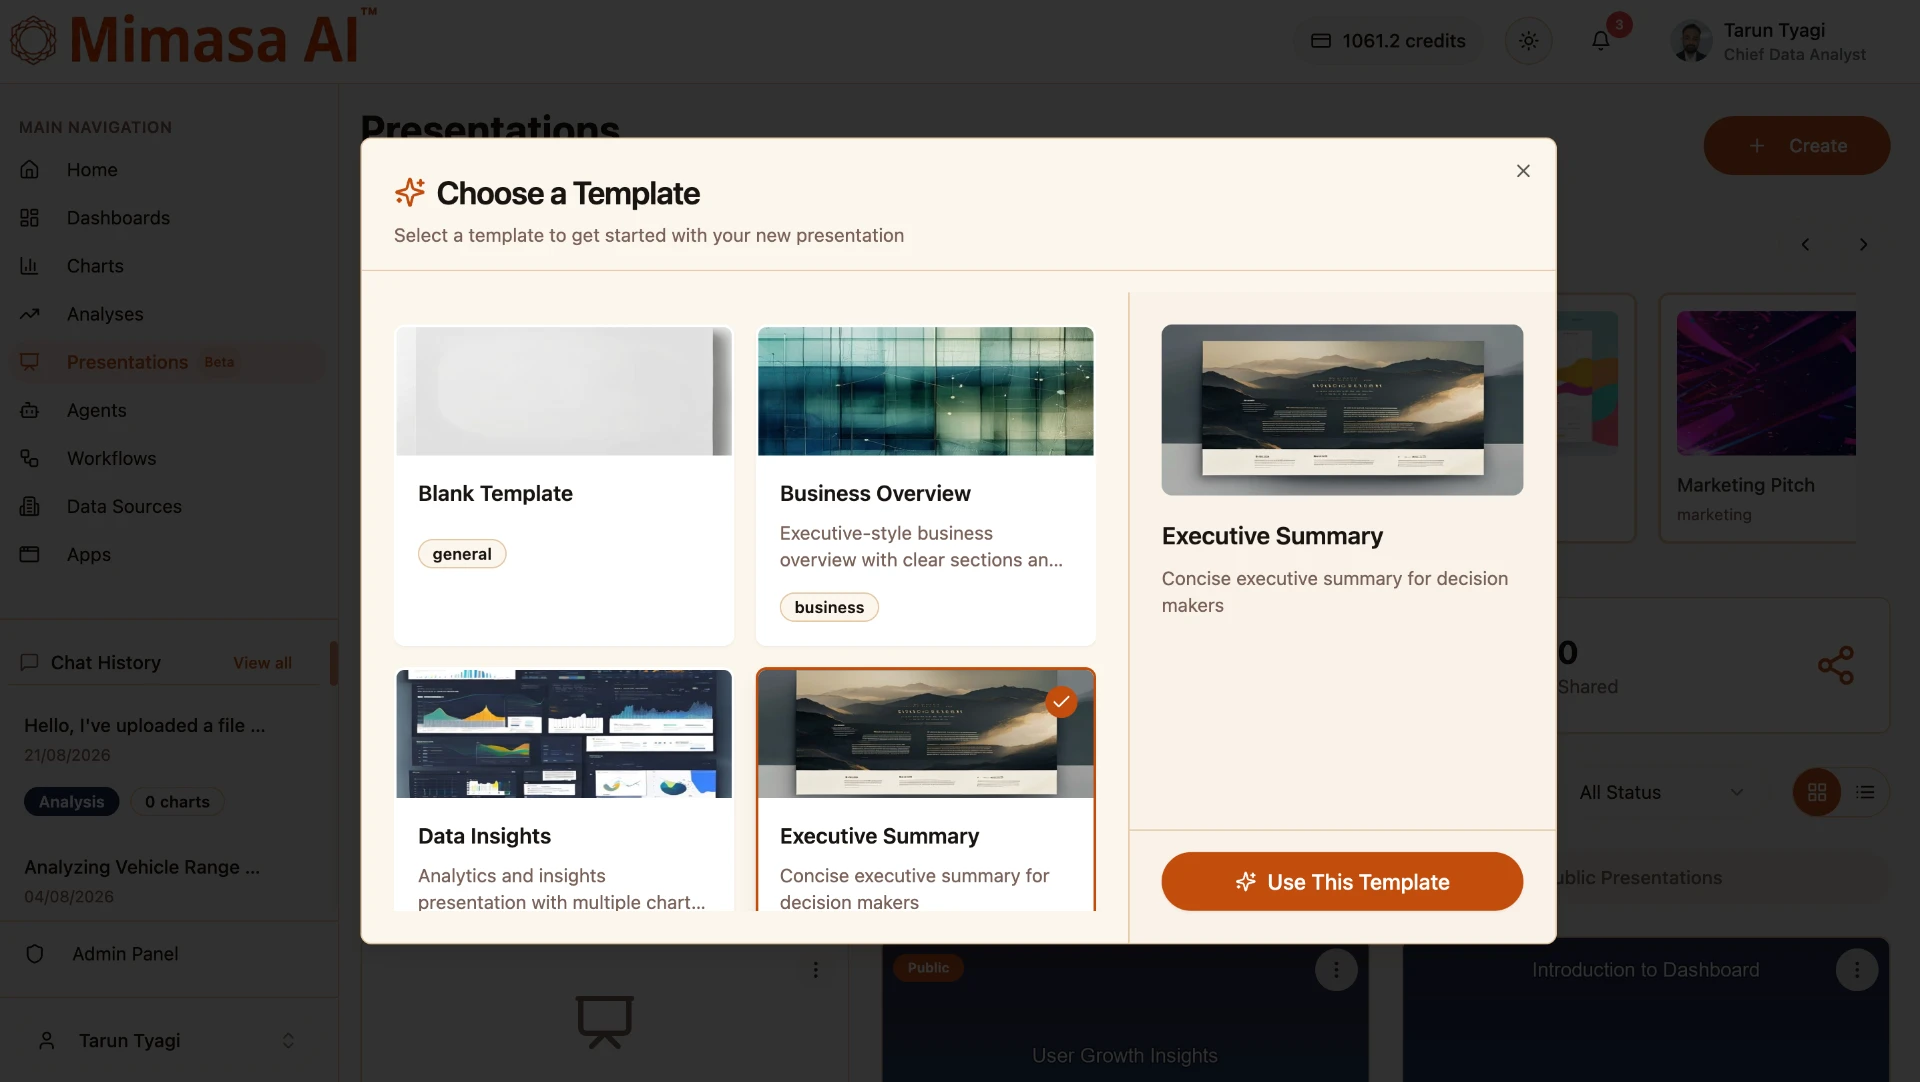
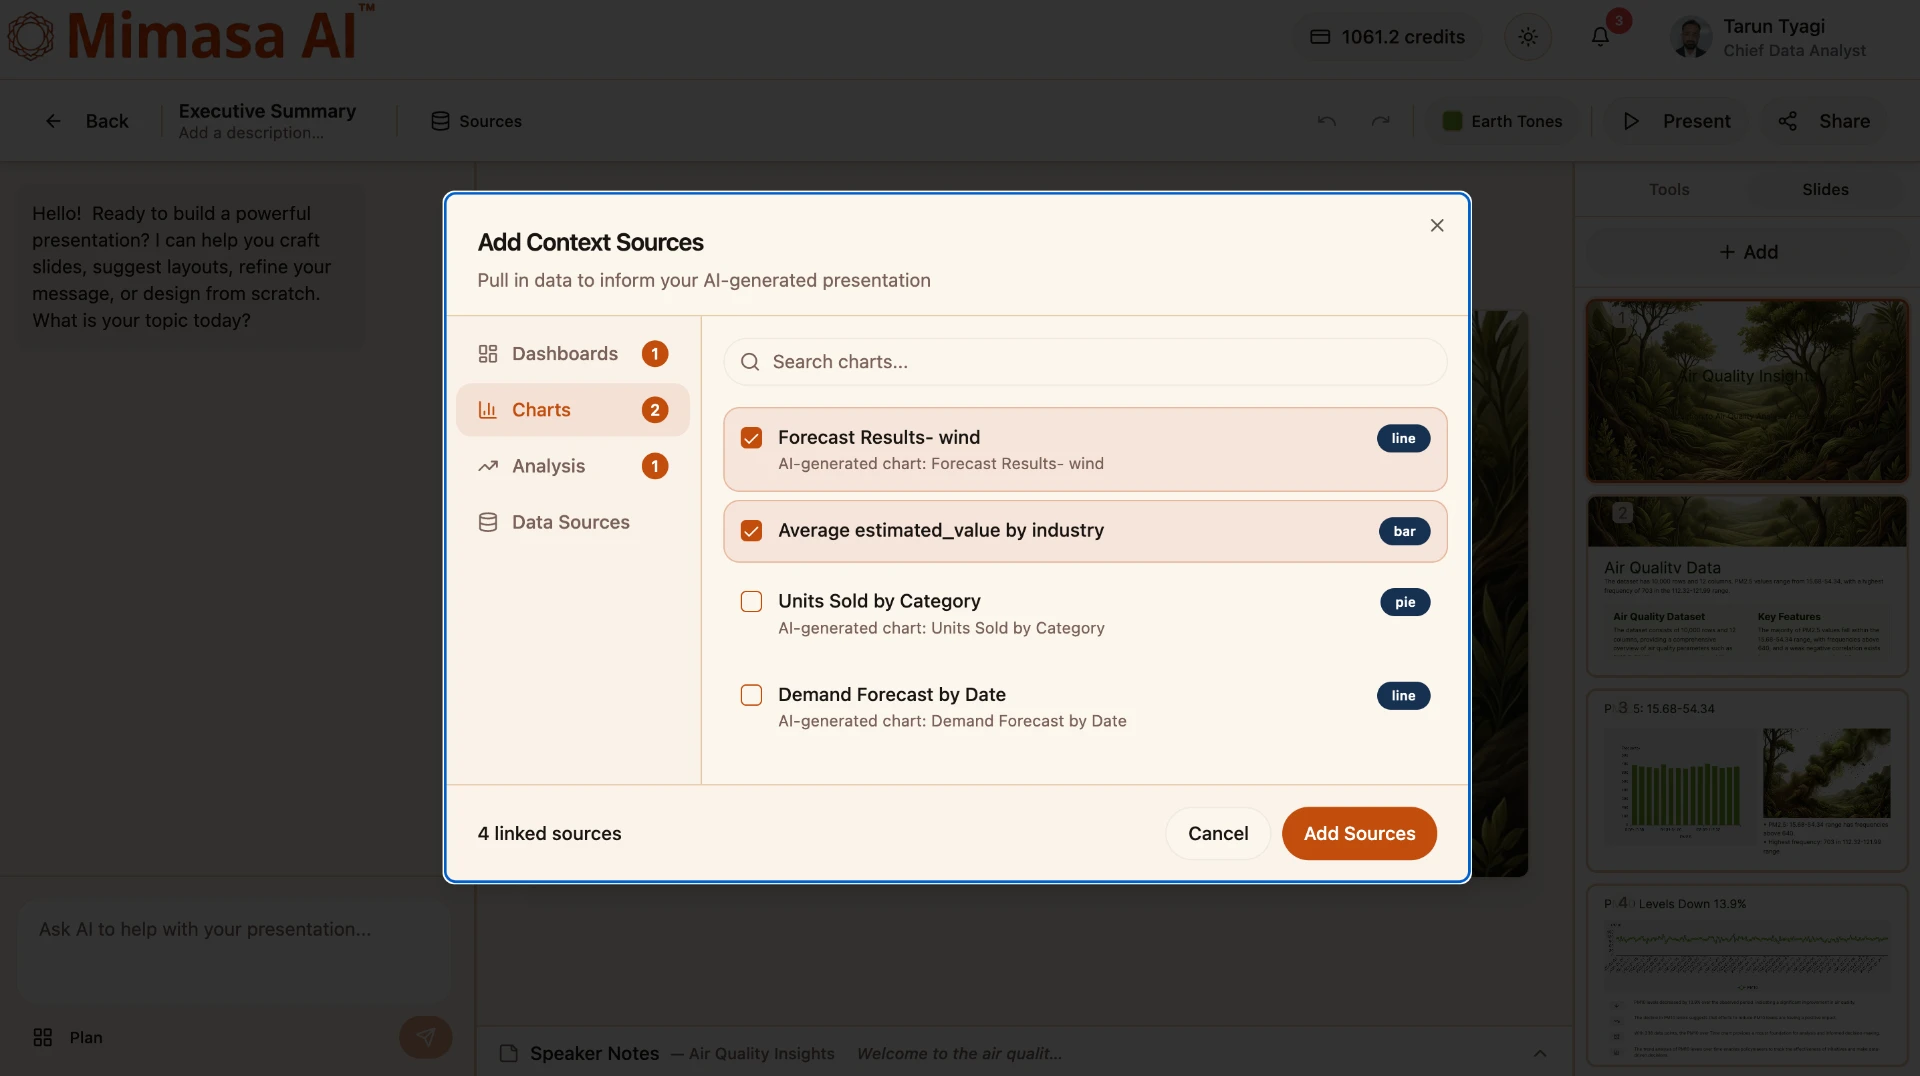
Point Mimasa AI at a dataset, a prepared snapshot, a dashboard or a saved analysis that already lives in your governed data layer.
Describe The Audience And Purpose
Say who the deck is for and what decision it supports — a board update, a monthly operations review, an investor summary.
Let The Narrative Assemble Itself
Significant patterns are identified, charts are selected, an executive summary is written and the slides are ordered as problem, analysis, insight and recommendation.
Shape The Tone And Branding
Adjust structure, wording and visual treatment so the output reads like your organisation rather than a generic template.
Share, Then Refresh Next Cycle
Because the deck is built on connected data, the next review is a regeneration rather than a rebuild.
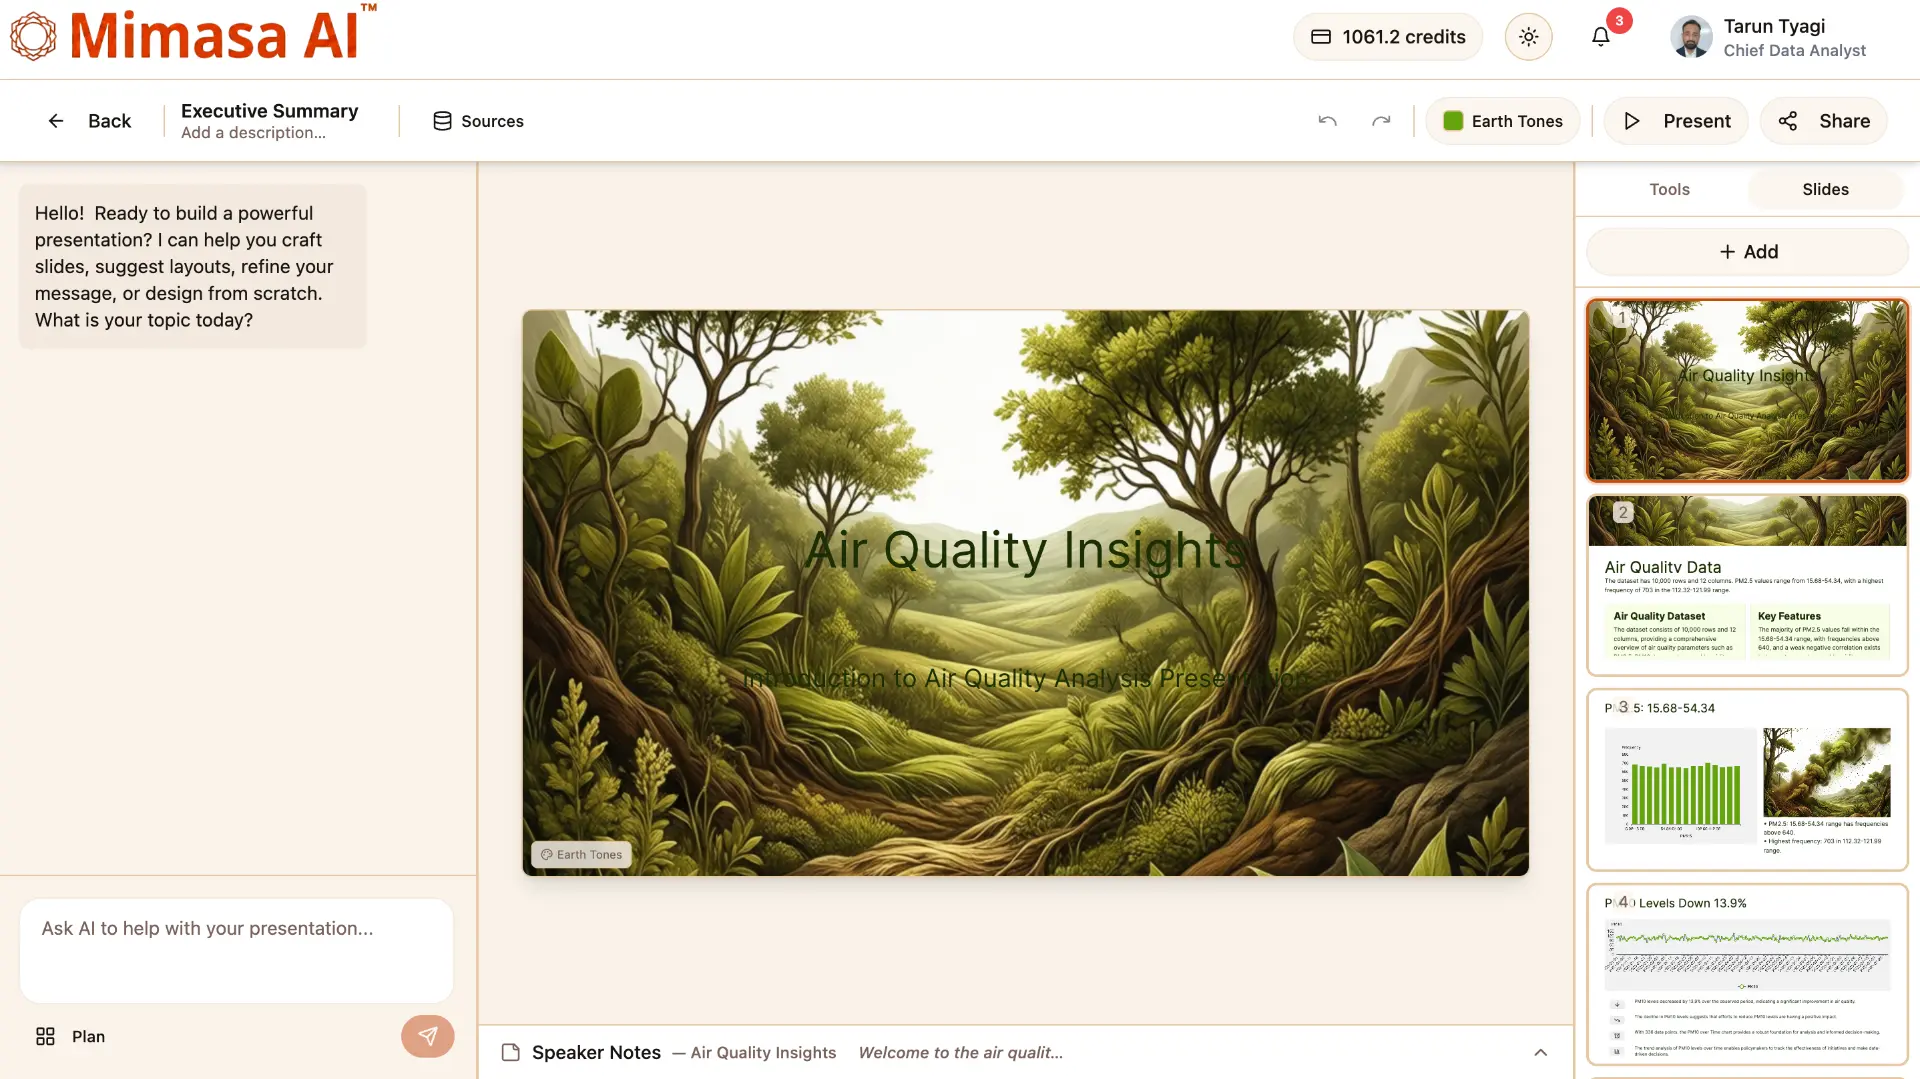
What The Data Presentation Software Does For You
Chart selection, narrative writing, slide structure and refresh — handled inside the same platform that governs the data, so nothing has to be exported to be explained.
Intelligent Storytelling Engine
Finds the signal in the analysis and arranges it as an argument — what changed, why it matters, what to do next — instead of a pile of charts.
Automated Chart Generation
Selects an appropriate visual for each point, highlights trends and comparisons and keeps the chart tied to the data behind it.
Executive Summaries In Plain Language
Written summaries, slide titles and key takeaways generated from the analysis, so the reader gets the conclusion without decoding the numbers.
Connected, Refreshable Decks
Presentations are built on live governed data rather than pasted screenshots, so recurring packs stay current between cycles.
Tone And Brand Control
Move between a formal investor deck, an operational review and an analytical deep dive while keeping one visual identity.
One Chain From Data To Deck
Extraction, transformation, governance, dashboards, reporting and presentation sit in the same platform, so the story never leaves the governed layer.
Your Dashboards And Reports Become The Deck
Dashboards are built for continuous monitoring and reporting is built for written analysis. A presentation is a different job: taking one audience through one argument at one moment. Mimasa AI reuses the work already done in dashboards and data visualization and in insights and reporting rather than asking anyone to recreate it slide by slide.
- Charts carried across without exporting images
- Written analysis reused as slide narrative
- The same governed figures in the dashboard, the report and the deck
A Slide Should Be Traceable, Not Just Persuasive
Presentations draw on datasets and snapshots that already carry ownership, access rules and documentation inside data governance. When someone in the room asks where a number came from, the answer is a governed dataset rather than a spreadsheet on somebody's laptop.
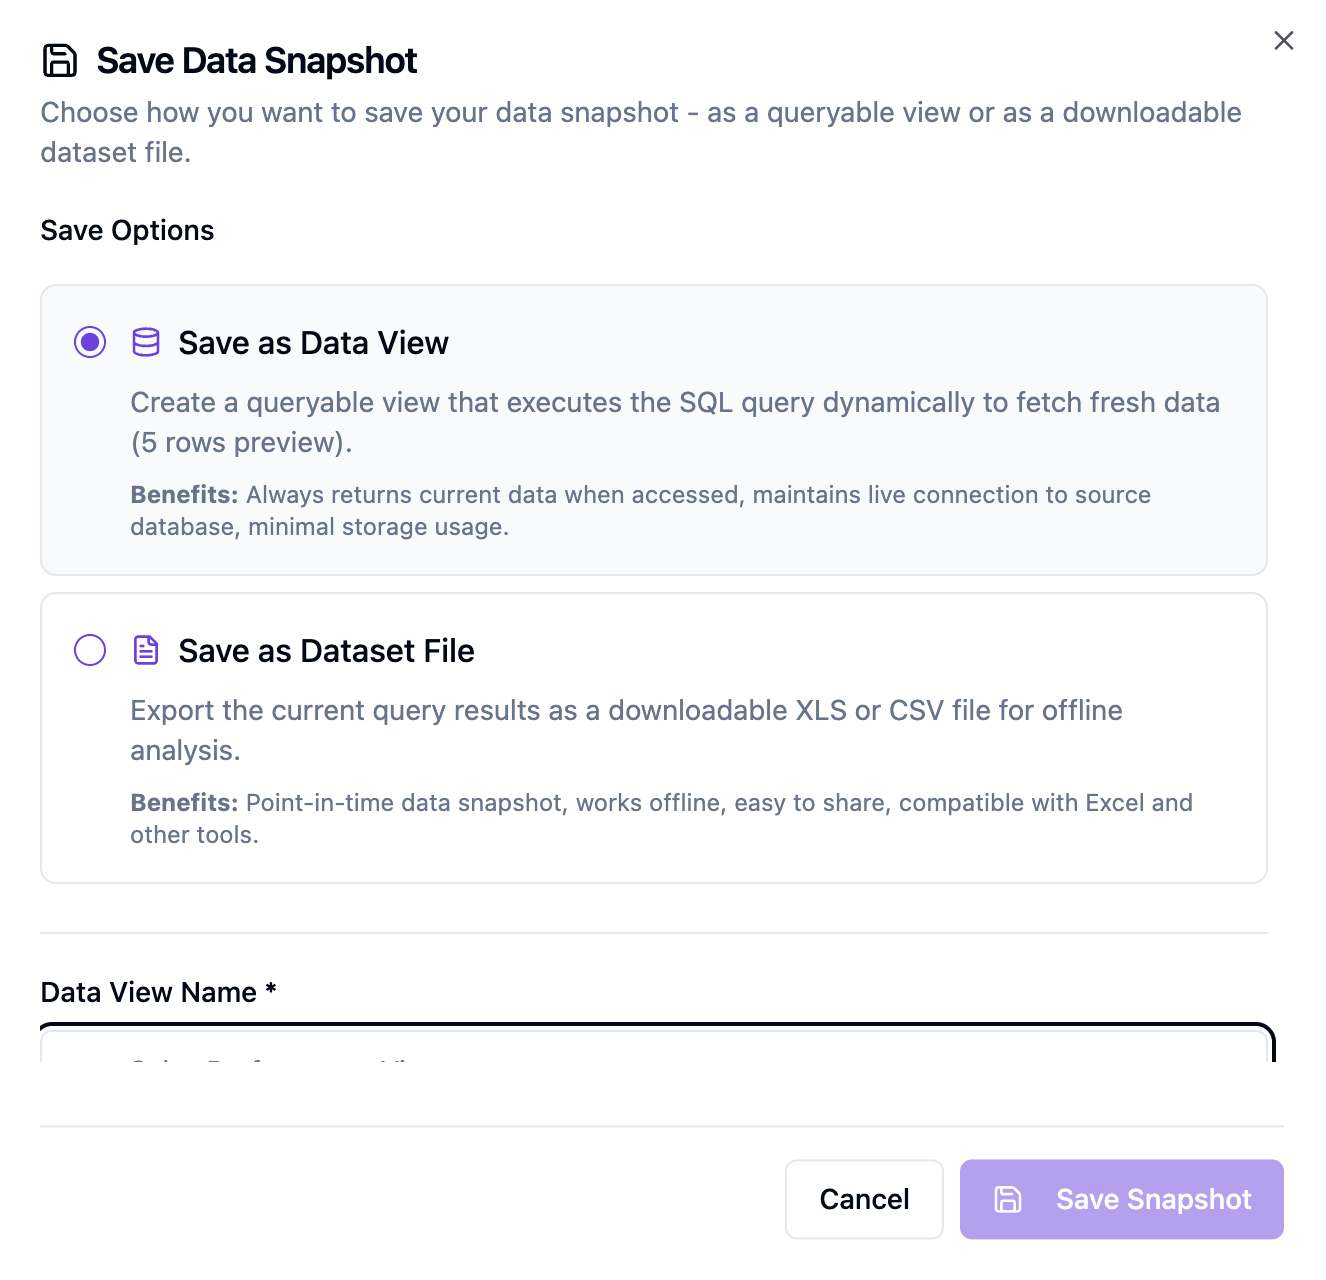
The chain behind every deck is visible end to end: extraction, transformation and reusable data snapshots feeding the analysis that the presentation explains.
Let The Recurring Pack Produce Itself
Monthly reviews, weekly performance packs and quarterly summaries follow the same shape every cycle. Hand that pattern to AI agents and agentic workflow automation so the analysis runs on a schedule or a trigger and the summary is waiting when the meeting starts.
Run On A Schedule
Monthly and weekly packs generated without anyone starting them.
Refresh, Don't Rebuild
The next cycle regenerates from current governed data.
Route It Onward
Deliver the finished summary to the people who act on it.
Built For Everyone Who Has To Explain A Number
Business intelligence reporting stops being a specialist craft when the deck assembles itself from governed data.
Leadership And Boards
- Board and investor updates
- Quarterly performance narratives
- Strategy reviews backed by governed numbers
Analysts And Data Teams
- Monthly packs that regenerate instead of being rebuilt
- Analysis handed over as a readable story
- Fewer requests to reformat the same findings
Operations And Finance
- Performance and variance reviews
- Budget and cost discussions
- Departmental scorecards for recurring meetings
External Stakeholders
- Client and partner reporting
- Regulator and funder summaries
- Programme and project status updates
Hand-Built Decks Versus Mimasa AI
| What Changes | Building Decks By Hand | With Mimasa AI |
|---|---|---|
| Building slides | Assembled by hand, deck by deck | Generated from governed data and analysis |
| Charts | Exported images pasted in | Selected automatically and tied to the source |
| Narrative | Written from scratch every cycle | Executive summary drafted from the analysis |
| Freshness | Frozen the moment it is pasted | Refreshed from connected data |
| Consistency | Each team brings its own figures | One governed set of numbers behind every deck |
| Recurring reporting | A rebuild each month | Regenerated, or produced by an agent on a schedule |
Presentation Is The Last Step Of One Governed Chain
Explore the products that feed it — enterprise data analytics, governance and automation working from the same source of truth.
Data Presentation FAQs
Common questions about AI-generated presentations, governed data and recurring reporting.