
Data Is Not The Bottleneck. Analysis Is.
Most teams already have dashboards. What they lack is the time between a question and a defensible answer, and the confidence that the number in the deck matches the number in the source system.
The Question Waits In A Queue
Every new question becomes a ticket. By the time the analysis is ready, the decision has already been taken without it. Analysts spend their week servicing requests instead of investigating the business, and the backlog grows with every new question.
Numbers Arrive Without The Why
A dashboard shows the movement. Nobody has time to explain what caused it, so the meeting argues about the figure instead of the action. Interpretation is the scarce skill, and it is the part most reporting and analytics software leaves entirely to people.
Reports Are Rebuilt Every Cycle
The same monthly pack is copied, pasted and reformatted by hand, which is exactly the work automated reporting software should absorb. The value is in the commentary, yet most of the effort goes into assembling the same layout again.
From Governed Data To A Sent Report In Four Steps
Connect Governed Data
Point the analytics platform at governed datasets and intelligent data snapshots rather than one-off spreadsheet exports.
Ask In Plain Language
Type the business question. AI for analytics interprets the measures, dimensions and period involved.
Get The Insight, Not Just A Number
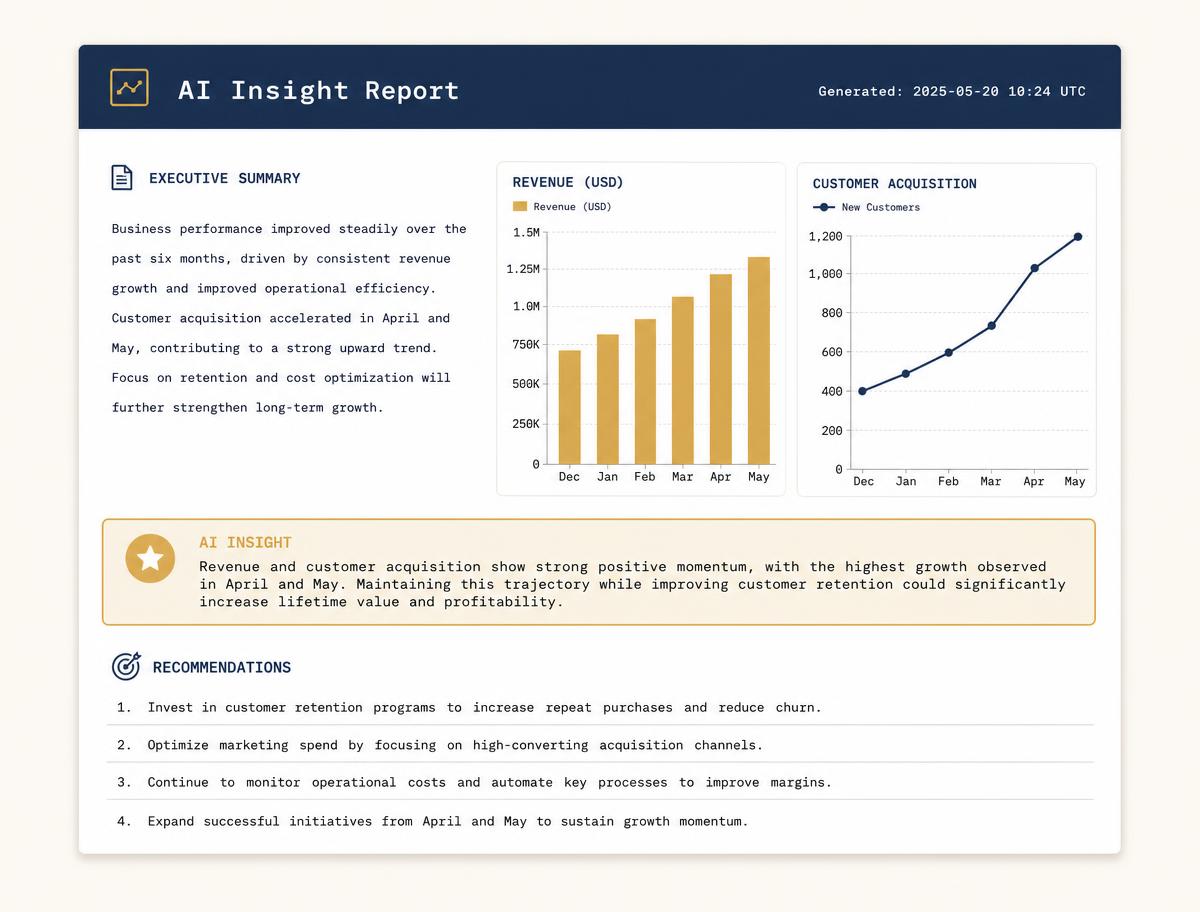
AI driven analytics surfaces the pattern, the anomaly and the likely driver, with the supporting visual beside it.
Publish Or Schedule The Report
Turn the finding into a structured report and send it once or on a recurring schedule to the people who act on it.
See How Simple Data Analysis Becomes
Watch a question go from plain language to analysis, chart and written summary. No query editor, no formatting pass, no waiting on a reporting queue.
- Ask the question the way you would say it out loud
- See the supporting evidence beside the answer
- Publish the result as a shareable report
What The AI Analytics Tools Do For You
Analysis, explanation, reporting and distribution in one governed place, so the path from a raw dataset to a decision-ready document never leaves the platform or loses its lineage.
Automatic Insight Detection
Augmented analytics software scans governed data for shifts, outliers and correlations so a change is found before someone thinks to look for it.
Contextual Explanation
Each result comes with the context behind it — which segment, which period, which contributing factor — instead of a bare percentage.
Narrative Report Generation
These AI reporting tools draft the written summary around the charts, giving you a first version to edit rather than a blank page.
Scheduled Distribution
Run a report daily, weekly or monthly and deliver it automatically, which is the part of analytics reporting software teams repeat most.
Structured, Shareable Output
Reports keep a consistent structure — summary, evidence, recommendation — so stakeholders read them the same way every time.
Role-Based Access
Permissions decide who can view, edit and share a report, and each reader only sees the data they are authorised to access.
Audit-Ready Lineage
Every figure traces back to its governed dataset and transformation, so a reviewer can verify a number rather than trust it.
Insight To Action
Findings can trigger Mimasa AI agents and workflows, so this AI and data analytics platform ends in an action, not an attachment.
Reports Your Teams Already Produce, Generated For You
Executive Summary
One page: what moved, why it moved and what to decide.
Performance Report
Recurring view of targets, trends and variance by team or region.
Ad-Hoc Analysis
A specific question answered once, with the evidence attached.
Stakeholder Update
Visual highlights packaged for people outside the data team.
Audit-Ready Pack
Figures with lineage back to governed sources and definitions.
Scheduled Report
The same pack generated and distributed on a fixed cadence.
Manual Reporting Versus Augmented Analytics
| Dimension | Manual Reporting | Mimasa AI |
|---|---|---|
| Producing analysis | Analyst writes the query, builds the view and formats the output | Ask in plain language and AI powered analytics assembles the result |
| Finding what changed | Someone has to think to look for it | Anomalies and drivers are surfaced automatically |
| Writing the commentary | Written from scratch each cycle | AI reporting software drafts the narrative for review |
| Recurring packs | Rebuilt and re-sent by hand | Generated and distributed on a schedule |
| Trust in the numbers | Depends on which export was used | Governed datasets with lineage behind every figure |
| What happens next | The report is filed | The finding can start an agent or workflow |
One AI Powered Analytics Platform, Every Reporting Cycle
Finance
Variance, margin and close reporting with traceable figures.
Sales
Pipeline movement, win-rate shifts and territory performance.
Marketing
Campaign and channel results summarised for the weekly review.
Operations
Throughput, exceptions and supply-chain deviations explained.
Government Analysts
Scheme, budget and project reporting with audit lineage.
Leadership
One consistent read of the business instead of five versions.
Part Of One AI And Data Analytics Platform
Insights sit on the same governed foundation as extraction, preparation, dashboards, agents and automation, so an answer you trust in one product carries the same definitions everywhere else in Mimasa AI.
AI Analytics And Reporting FAQs
Common questions about analysis, automated reports and governance in Mimasa AI.